Sales Rep Dashboard
Sales Rep Dashboard
A sales rep dashboard is considered one of the most useful tools that can help drive sales. A sales rep dashboard can be used to provide valuable insights into the overall sales process in a single glance.
A sales rep dashboard organizes and presents sales metrics and key performance indicators in a graphical format. This allows teams to track the progress of their sales pipeline. The information displayed on a sales rep performance dashboard can enable sales leaders to transform raw data into actionable business decisions.
Many top salespeople depend on their sales dashboard to monitor their daily operations. A sales rep dashboard may vary according to industry type, nature of customers, size of company, as well as job duties and responsibilities. A sales dashboard can help teams understand their sales process as well as create and set realistic goals.
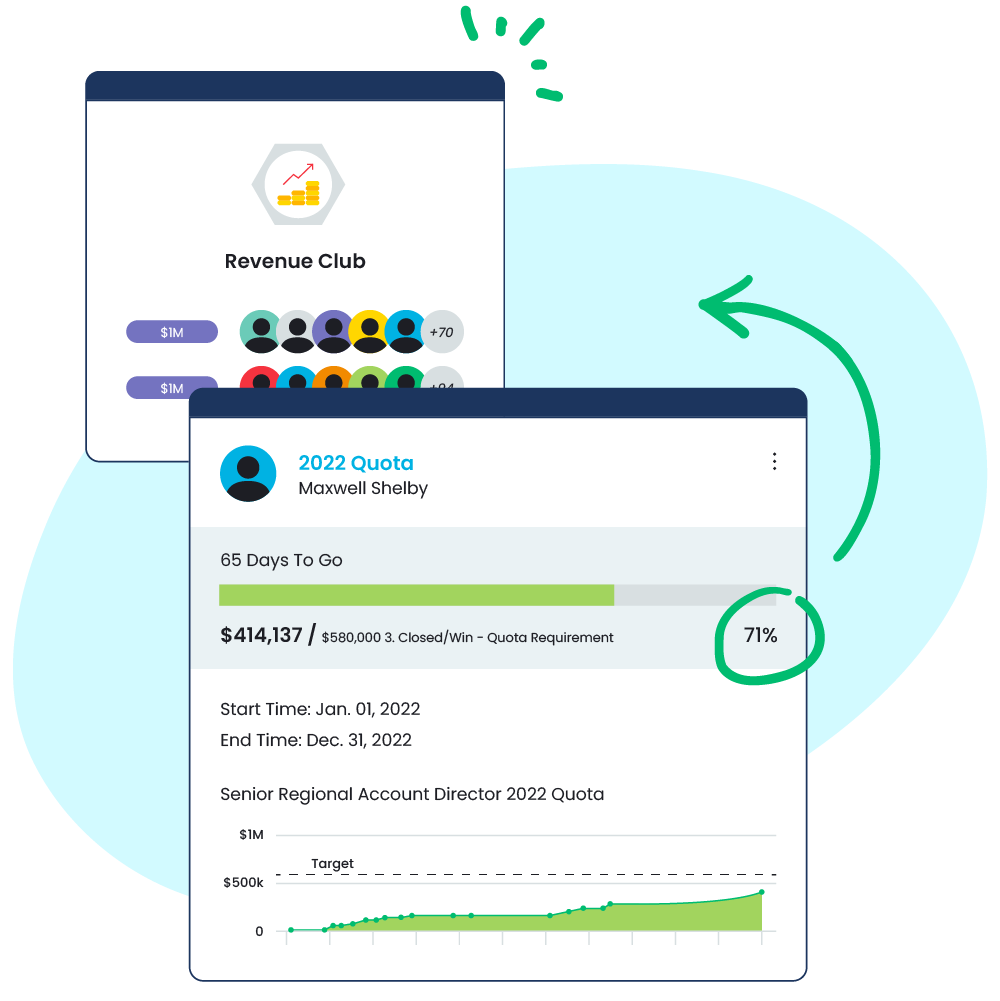
A sales dashboard design can enable sales reps to visualize their personal goals and metrics throughout the sales funnel. Having a visual representation of key metrics can help boost sales performance. Sharing personal dashboards with other team members may help sales reps understand the contributing factors that can help increase their sales numbers.
Using a sales dashboard software such as Ambition Dashboards can help companies turn raw sales data into actionable performance insights. Ambition Dashboard can allow teams to create dynamic sales dashboards that can automate goal setting, coaching, and reporting, as well as enhance competitions.
The Ambition Dashboard can be broadcasted into sales leaderboards that are visible to the entire organization. With Salesforce CRM (customer relationship management) or API (application programming interface) integration options, sales teams can bring together all of their data into a central sales dashboard.
Sales Rep Dashboard Salesforce
When it comes to sales rep dashboard salesforce and sales dashboard salesforce, sales dashboard design templates with easy-to-use and built-in style guides can help teams in recording sales activities. Sales dashboards allow for real-time monitoring and graphic representation of sales information. For example, when making a sales dashboard, Tableau has layouts and design templates which teams can use to create a visual image of their sales data.
In order to keep sales reps engaged and aligned with company objectives, it may be beneficial to provide teams with more visibility into sales numbers. Companies can develop people-first, metric-driven teams by using a sales performance management platform such as Ambition. Ambition can help sales leaders obtain valuable insights from raw data, which can help promote a winning culture on the sales floor.
In building a sales dashboard, Salesforce is considered a useful tool to directly embed sales scores. By connecting their Salesforce account to Ambition, sales teams can automate and gamify the monitoring of their sales activities. Sales teams can track and score outbound and inbound calls, which can then be included in the sales scorecard. This can encourage sales reps to log sales activities, as it boosts their daily or weekly activity score and puts them on top of sales leaderboards.
With the Ambition and Salesforce integration, sales reps can log sales activities in Salesforce, and the activity score is calculated automatically based on how the manager puts value on particular sales activities. Sales reps may be rewarded for concentrating on the most lucrative sales tasks, and they can track their own progress in Salesforce. At the end of the day, each rep will be able to assess whether they are meeting their team’s growth goals.
An Executive Analysis
How Sales Coaching Impacts Key Business Metrics

Sales Dashboard Examples
Companies can refer to various sales dashboard examples or use an Excel dashboard template to track their team's progress toward achieving specific goals. A sales dashboard can also be used to manage workflow, identify issues that need to be addressed, and set team objectives based on existing data. Organizations may opt for a custom sales dashboard app specifically designed to meet the needs of their teams. A sales dashboard app can be used by team leaders to make smarter decisions based on sales analysis and improve their bottom line.
Sales dashboards can give businesses a snapshot of how their teams are performing. Sales dashboards can help sales managers understand how their sales teams are doing in comparison to specific goals and past performance. Using a sales dashboard that refreshes automatically such as Ambition Dashboard allows sales managers to save time by not having to run multiple sales reports.
A sales performance dashboard can assist sales team leaders in monitoring how their teams are performing across all key sales performance indicators, as well as in analyzing their previous performance. A sales performance dashboard—which displays important sales metrics, goals, and activities in a visual format—can help teams identify their areas for improvement and implement the necessary changes to improve the sales process.
Best Sales Dashboards
The best sales dashboards should provide teams with useful information into the overall sales process, as well as their sales performance and activities. It would also be beneficial if sales dashboards are fully automated and can integrate easily with various systems.
Creating a gamified sales dashboard can also help teams celebrate their accomplishments when they reach key sales milestones. Sales team members are more likely to be more engaged and perform better when they receive points or rewards for meeting sales targets.
Businesses may use a monthly sales dashboard to analyze and monitor monthly sales performance. A monthly sales dashboard captures current sales data in a visual format. Rather than having to sift through raw data or long and complex sales reports, salespeople can absorb information more easily when data is presented with visual elements on a single page. Sales teams can use a monthly sales dashboard to get a quick overview of their current progress, identify trends, and compare their current performance to previous months' performance.
Companies that have multiple data sources synced into their Salesforce CRM can benefit from using Ambition as part of their Salesforce setup. Salesforce dashboard components such as charts, tables, metrics, and gauges are used to represent data. Ambition can pull data from Salesforce in real time and display key metrics on leaderboards and personalized dashboards for each rep. This can give organizations and teams 24/7 visibility into the activities and objectives that can drive big results, as well as the ability to see which sales reps are converting sales activities into goals and outcomes.
Sales Pipeline Dashboard
Companies can use a sales pipeline dashboard, or specifically sales pipeline dashboard tableau, to understand the status of their sales pipeline. A sales pipeline dashboard displays all leads at various stages. A sales pipeline can be used to check if a company is on track to meet its annual goals.
A sales pipeline, also known as a sales process, refers to a sequence of steps that sales representatives must follow in order to convert qualified leads into potential customers. A sales pipeline can help businesses track the progress of deals that their sales teams are currently working on and predict when a deal will be closed. Companies can use data from the sales pipeline to map out their marketing and sales strategies in order to generate revenues.
To create the best sales pipeline dashboard, sales teams must first build a strong sales pipeline. This may require an in-depth knowledge of their target accounts or customers, existing prospects, sales progress, as well as their company and team goals.
When analyzing a sales process, reps and team leaders can use visual representation to see where their leads have dropped off, the specific activities that affect their bottom line, and evaluate if their current process is working and generating better leads.
Companies may benefit from following some of the most common steps in building a sales pipeline. Prospecting, the first stage of the sales process, is the process of starting and growing a new business by looking for potential customers. Cold calling, prospecting for potential good fits on LinkedIn, or working with a lead generation team are some of the options. The qualifying stage involves assessing potential customers to see if they are a good fit for a company's products or services. Communicating, on the other hand, entails establishing relationships with potential customers and nurturing leads. A sales scorecard can be used by companies to keep track of sales reps' communications and activities. The next stage involves gaining customer trust, when a customer or prospect decides to make a purchase. Finally, nurturing is critical for building and reinforcing relationships with customers at each stage of their buying journey.
Daily Sales Dashboard
Businesses can make informed business decisions, increase their investments, and grow their businesses by having accurate, predictable sales figures. Having erratic sales figures could indicate a potential problem with business or sales planning that may need to be addressed right away.
In creating a daily sales dashboard, companies may use a sales dashboard template. Excel sales dashboard templates can also be used by organizations to make sense of their existing data.
A daily sales dashboard can enable sales teams to adjust their daily activities in order to get them closer to their daily sales objectives. A daily sales dashboard can show sales representatives the number of sales calls made, deals closed, and proposals that have been sent out. This information can provide salespeople a clear picture of how their daily activities can either boost or stifle sales.
Sales Dashboard KPI
In creating a sales dashboard, KPI, or key performance indicators and in making use of KPI dashboard Excel, can enable teams to set attainable goals, as well as compare closed opportunities to better understand their sales strategies.
Ambition' s downloadable scorecard templates include built-in formulas, KPI examples, and a KPI calculator that shows the exact number of activities and objectives that sales reps must complete on a daily or weekly basis to meet their objectives. This can assist sales reps in staying on track to build pipeline, meet and exceed quotas, and consistently hit sales targets.


