Sales Dashboard
Software


Real-Time Sales Dashboards to Power Your Contests, Coaching and Automated Sales Alerts
Create Your Sales Dashboard with Data from Anywhere
Ambition was designed to be the heart of your sales tech stack. With out-of-the-box Salesforce or API integration options, you can bring all of your data into a central sales dashboard.
If you have multiple data sources already synced into your Salesforce CRM, they will seamlessly integrate into Ambition as part of that Salesforce installation process.
Your sales dashboard software should be able to house many metrics from multiple sources without requiring you to get a masters degree in CRM administration.
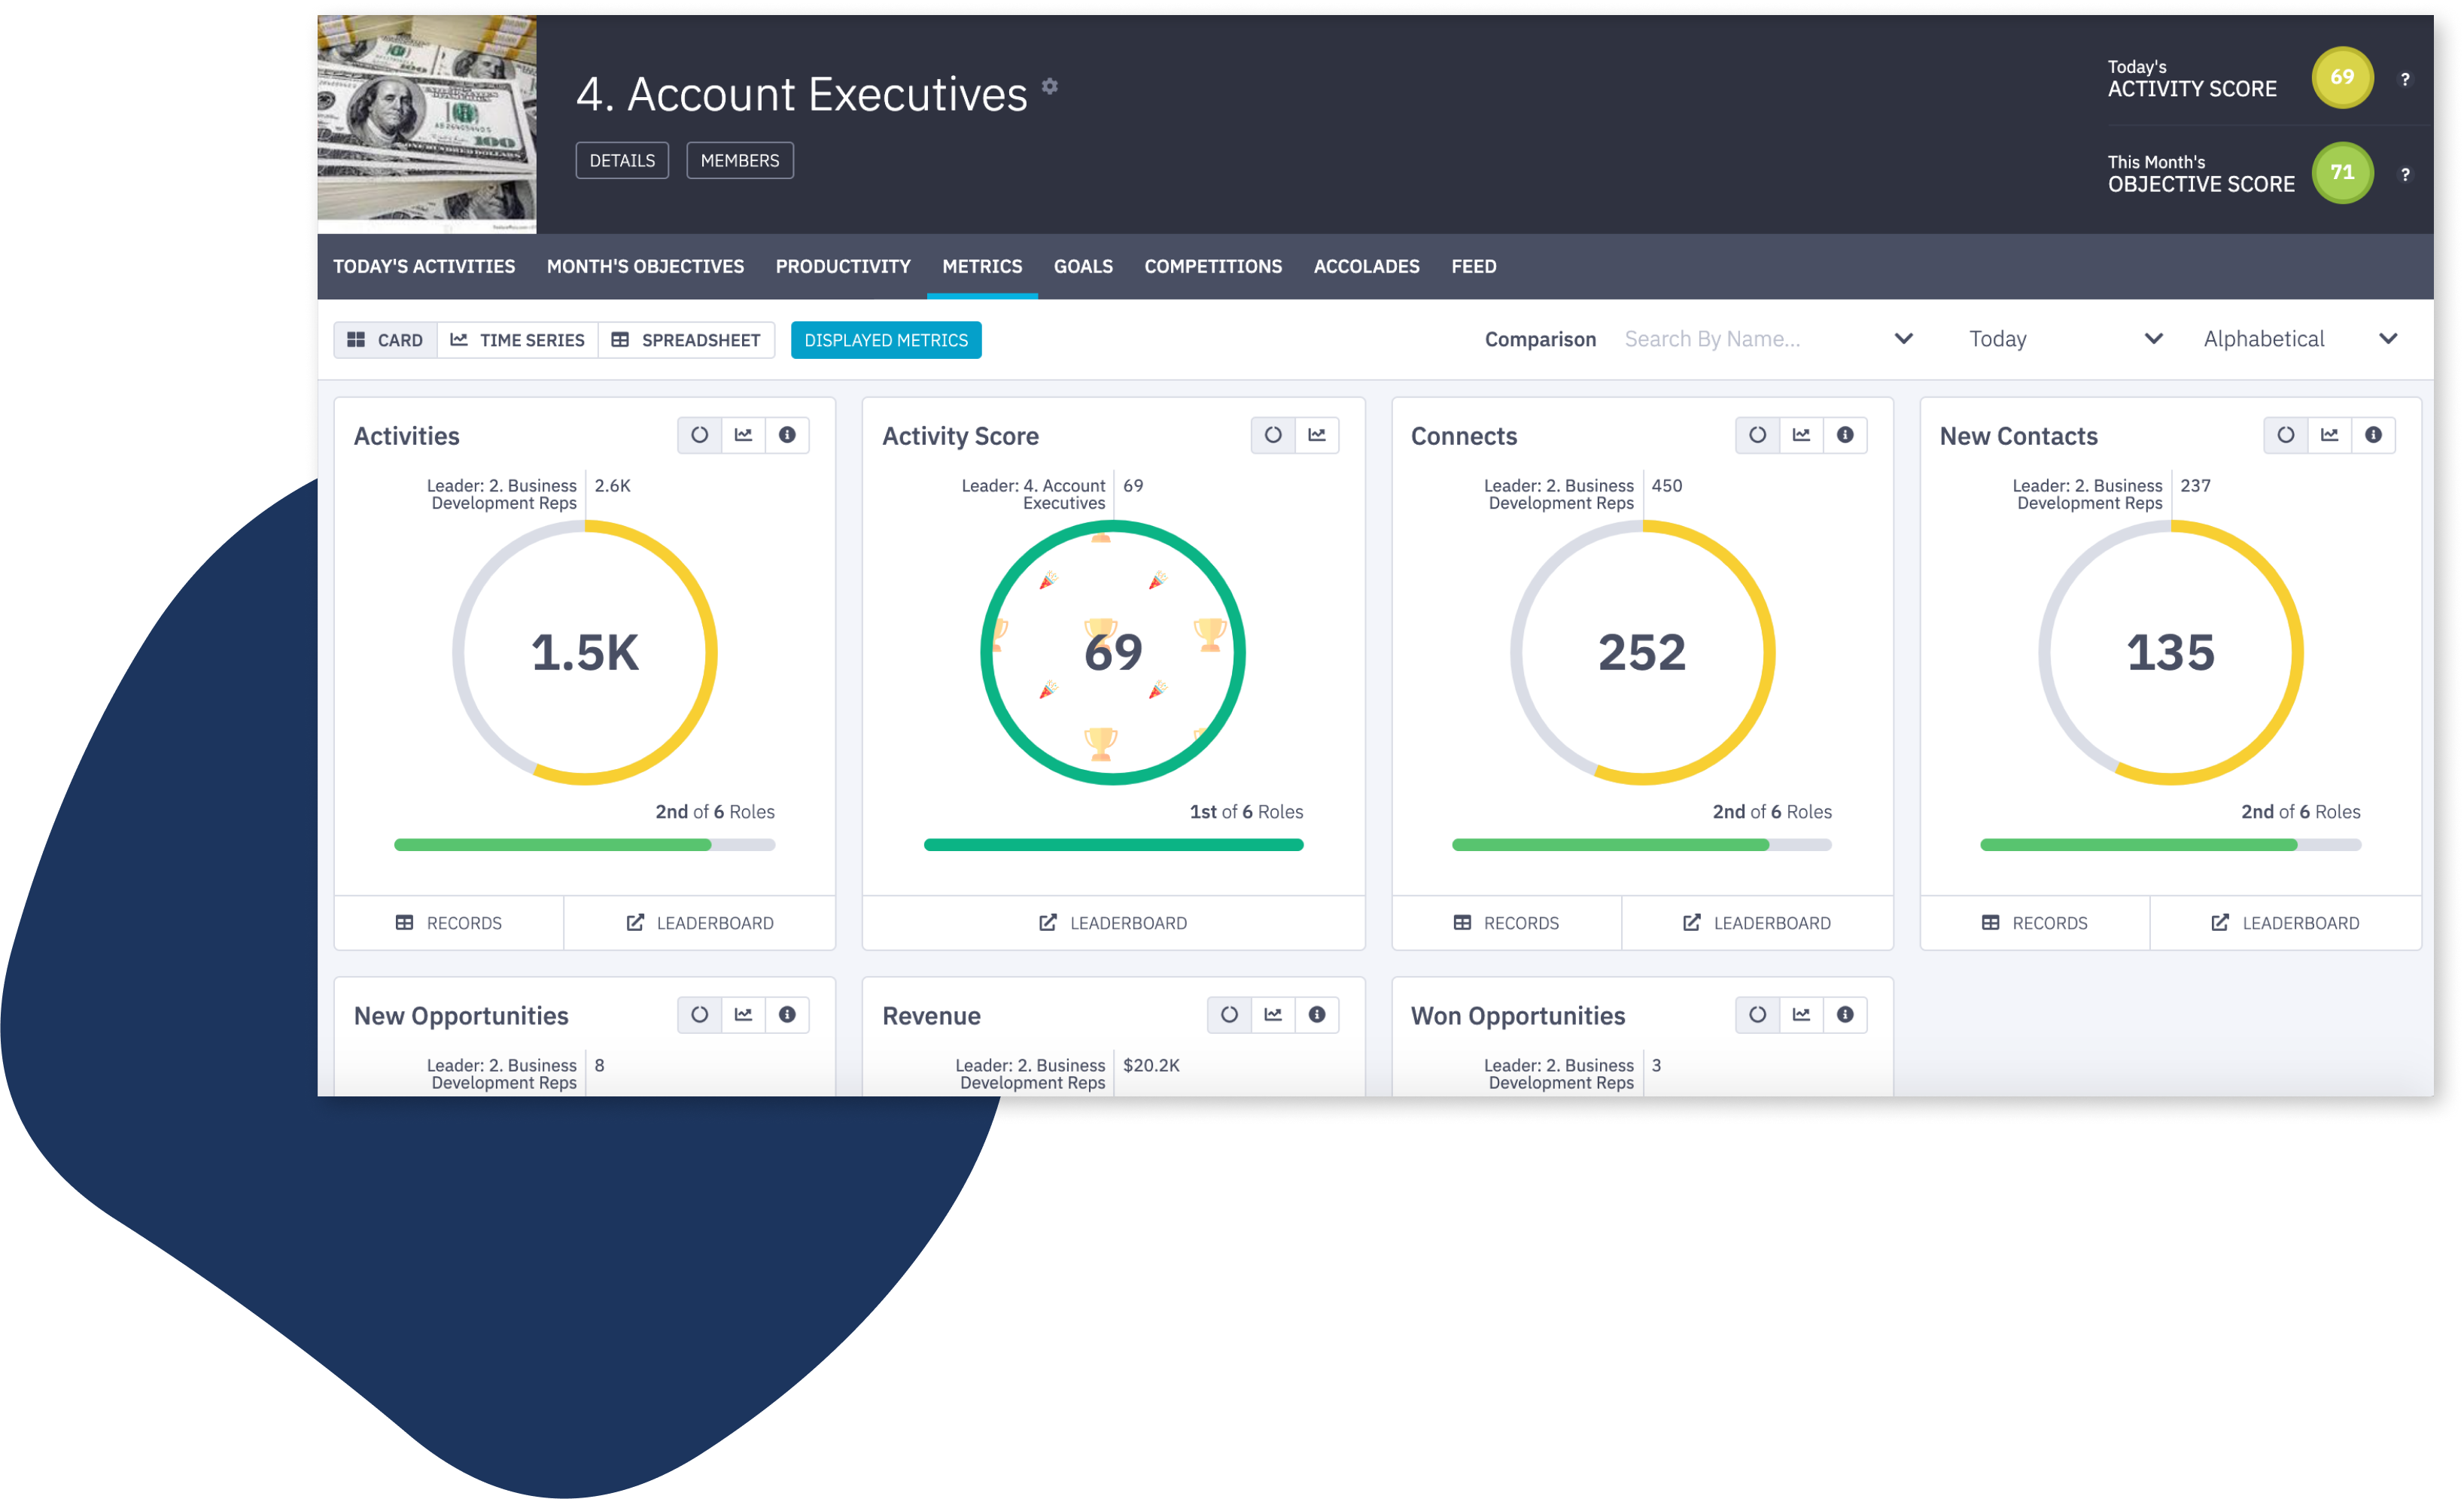
Ambition makes it easy to sort, rank and modify your data to go beyond the numbers and drill down into the individual contributors that make up the data allowing you to coach to the right metrics for the right people.
Sales dashboard software is useless if it doesn't also allow you to perform actions or run programs that impact the numbers. That is why over 3,000 sales managers around the globe are turning away from managing their team out of a customer relationship management software-- leveraging the power of Ambition's sales dashboard software to automate contests, coaching, goal-setting, reporting and more.


"We adopted Ambition because we had a problem. We didn't have the level of visibility or excitement around how things were going in the office. Ambition has helped double our SDR productivity. Great support. Easy to use."

Not Just a Sales Dashboard, but Automated, Proactive Sales Alerts
When you need to keep an eye on performance and productivity, you can set issue detection alerts for calls, meetings, or other key KPIs falling off pace. Receive the issue detection alert to step in and coach before the targets are missed-- without ever logging in to your sales dashboard.
"Ambition gives me visibility into my leading indicators and lets me put incentives and pushes in-place to influence outcomes that we are looking for."

Go Beyond Basic KPIs and Unlock Efficiency Metrics
Efficiency metrics are a better way to gauge performance than sheer quantity counts when it comes to sales KPIs. These efficiency percentage metrics tell you who's performing well (and who's not) based on the opportunities they're given. All of these are coachable metrics where you would expect to see your reps improve over time — and you can view them right inside your Ambition sales dashboard. A few examples:
- Call connects to meetings set ratio
- Meetings held to opportunity ratio
- Emails sent to emails open ratio
- Calls to call connects ratio
Ambition's sales dashboard software shows you how your reps are taking “at-bats” and converting those through your sales funnel. Don't assume that the rep with the most meeting sets is the top performer. Leverage the ratio of call connects to meeting sets to understand your top converter and what it could mean if they improved connects with more quality lists. These are the metrics that show how sales managers are making improvements through coaching sessions and they are automated for you in Ambition.

Coaching, Contests, KPIs, Goals, and Progress — All in One Place

Sales Dashboard Examples
Sales Development Daily Dashboard Example
- Track daily calls, emails, sms, and social connections for every rep.
- Monitor touches to target accounts and ensure every rep completing those activities.
- See meetings set and how each rep compares against the leader.
- Show trends over time for calls, emails, meetings and pipeline conversion.
- Show pipeline $$$ per rep, progress toward team goal, and conversion of meetings to pipeline.
Account Executive Monthly Rollup Example
- Number of demos scheduled
- Number of demos held
- Conversion of demos to qualified opportunities
- Average deal size per opportunity
- Conversion rate of opportunities to closed won deals
- Annual contract value and total contract value month to date
Commonly Tracked Sales Dashboard Metrics
- Dials Made
- Inbound calls received
- Emails sent, opened, or clicked
- New contacts added
- Meetings/appointments set
- Meetings held
- Qualified opportunities
- Average order value
-
Meeting held to qualified
opportunity conversion rate - Qualified opoprtunity
pipeline $ value - Won opportunities
- Lost Opportunities
-
Opportunity to closed won/lost
conversion rate - Tickets created,
working, resolved - QBRs scheduled, held
- Expansions/Renewals
- Churn Rate
Frequently Asked Questions about
Sales Dashboards
- Sales Revenue: Total income from sales activities.
- Conversion Rate: The percentage of leads that turn into customers.
- Average Deal Size: The average revenue generated per deal.
- Sales Cycle Length: The average time it takes to close a deal.
Including a mix of outcome metrics (like revenue) and performance metrics (like conversion rate) offers a balanced view.
Ambition goes above and beyond to make sure our sales dashboard software is innovative and top of the market.
- Integration Capabilities: It should easily integrate with existing sales tools and databases.
- Customization: Offers flexibility in dashboard design and metric tracking.
- Scalability: Can grow with your business needs.
- User Interface: Intuitive and easy to navigate.