Sales KPI Examples
Sales KPI Examples
KPIs, or key performance indicators, are metrics used to help sales teams measure effectiveness and efficiency. By closely tracking KPIs, teams can discover processes and methodologies that are working well and improve upon those that are yielding less than favorable results. Due to the numerous insights they provide, KPIs are a critical aspect to business operations. They can illustrate how your company is performing in a number of areas, allowing you to assess the overall effectiveness of your business operations.
There are many different sales KPI examples you can look to for ideas on what sorts of metrics you might implement in your own business. For instance, KPIs used to track sales funnel performance can inform you on the quality of your leads at each stage of your sales funnel. It can also show you where the problem areas are—and this information can then be used to make changes as necessary. Tactical sales metrics can also be measured through KPIs. These might include activity ratios and average lead time response. In addition, KPIs can help you determine and evaluate your sales cycle length. Knowing the average amount of time a prospect spends from beginning to end can give you a better sense of the number of won deals over a given period of time.
You might also look to sales dashboard examples for ideas on how to create an effective dashboard for your sales process. Likewise, you could use a sales KPI template as a rough outline for what KPIs you’d like to measure, how you plan on measuring them, and what you plan to do with the data derived from this process. Understanding how to adequately monitor KPIs can be challenging at first. However, once you have established your methods and desired outcomes, these metrics can provide incredibly valuable insights into the overall health and wellbeing of your sales processes.
KPI for Sales Representative
Depending on your organizational goals, some KPIs may be more significant to consider than others. For example, a common KPI for sales representative personnel is individual sales numbers by store. Of course, it is important to track the number of sales across each store you manage, but being aware of the performance of each store individually can help you identify pain points and give your team a better understanding of what could be improved and where. Other KPI for sales representative examples include reach and response rates, pipeline value, and sales targets.
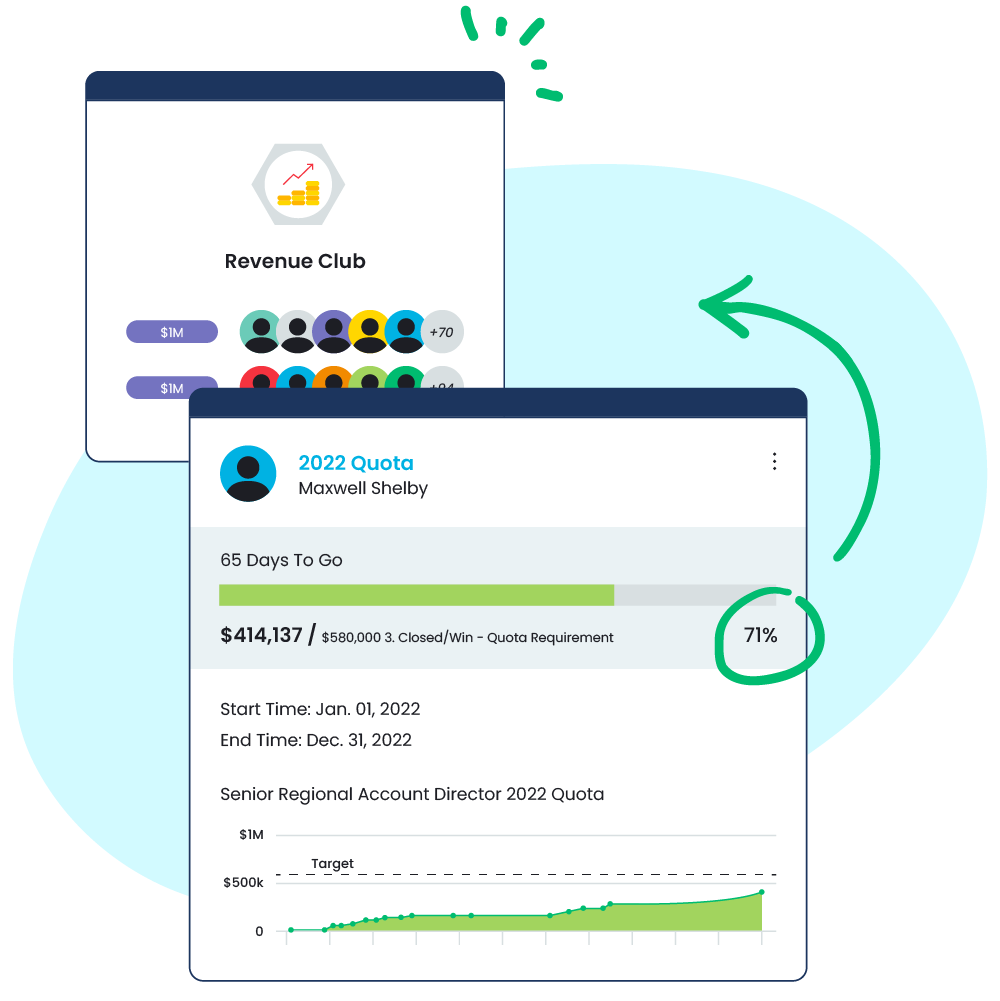
Sales reps can use a business development KPI dashboard to manage various KPIs in a centralized location. Dashboards visually depict business performance, providing a comprehensive, easily-digestible look at how your sales team is performing and what they’re doing with each KPI. Having a dashboard for your sales platform can keep you informed of key metrics and performance standards, enabling you to make better revenue-driven decisions. Dashboards can also provide real-time customer analytics such as current customers and retention rates, and offer sales cycle forecasting. These are just some of the reasons why sales representatives can benefit from viewing and managing KPIs through a sales dashboard.
An Executive Analysis
How Sales Coaching Impacts Key Business Metrics

Sales KPI Dashboard
As discussed previously, there are multiple advantages to using a sales KPI dashboard like the one provided by Ambition. Whether you’re interested in tracking B2B sales KPIs or more general metrics, your team can greatly benefit from using a sales dashboard to help you keep track of your various KPIs and business performance metrics. With Ambition’s real-time sales dashboards, you can power your contests, coaching, and automated sales alerts. The platform allows users to create sales dashboards with data from anywhere.
Ambition users are able to improve sales performance by moving away from static sales dashboards and into dynamic sales dashboard software that can automate goal tracking, power competitions, and be broadcast into sales leaderboards that are visible to those across the organization. Ambition makes it easy for users to manage their data, acknowledging that a good sales dashboard software should be able to house various metrics from multiple sources without requiring users to have a Masters degree in CRM administration.
Extending beyond basic KPIs, Ambition lets users unlock efficiency metrics—a more effective way to gauge performance than sheer quantity counts when it comes to sales KPIs. These efficiency percentage metrics let you know who’s performing well based on coachable metrics that can be used to track reps’ improvement over time. Some examples of viewable metrics within the Ambition sales dashboard include calls-to-call-connects ratio, emails-sent-to-emails-open ratio, and meetings-held-to-opportunity ratio.
Ambition’s sales dashboard software lets you know how your reps are taking “at-bats” and converting those through your sales funnel. With this platform you can leverage the ratio of call connects to meetings set to understand your top converter and what it could mean if they improved connects with more quality lists. These metrics are valuable for showing you how managers are helping to drive improvements through coaching sessions, and they are all automated for users within Ambition’s sales metrics dashboard.
Sales Performance Metrics
Using a sales KPI dashboard, you can control which sales performance metrics are most important and customize how you track performance. Sales productivity metrics, for example, can be implemented and monitored to provide insight into your team’s productivity across different stores and time periods. You could also use a sales metrics template as a guide for how to determine and track critical sales metrics.
With Ambition’s sales dashboards, users can track several different metrics. These include, but are not limited to dials made, inbound calls received, emails sent, new contacts added, meetings/appointments set, meetings held, qualified opportunities, average order value, meeting-held-to-qualified-opportunity conversion rate, qualified opportunity pipeline dollar value, won opportunities, and churn rate. Sales dashboards can show performance at the rep, role, team, or organizational level.
Ultimately, sales dashboards are key to analyzing sales performance, enabling managers to easily make smart, quick decisions based on data as opposed to assumptions or intuition. Sales dashboards can also save companies time, as managers are freed from having to spend hours setting up and running reports or shifting through spreadsheets to identify trends over time. Using sales dashboards, managers can identify opportunities for growth, as well as for more reliable, metric-driven forecasting.
Ambition was designed to be the heart of your sales tech stack. With out-of-the-box integration options, you can compile your data into a central sales dashboard. In the event that you have multiple data sources already synced to your Salesforce CRM, they can seamlessly integrate into Ambition as part of the Salesforce installation process. However, sales dashboard software is useless if it doesn’t allow users to perform actions or run programs that impact the numbers, which is why sales managers around the globe are leveraging the power of Ambition’s sales dashboard software to automate contests, coaching, goal-setting, reporting, and more.
Sales Performance Analysis
A common question that arises is simple: how to measure sales productivity? When trying to determine how to measure sales performance, there are a few things to keep in mind. First, you should consider conducting some sort of sales performance analysis. This could be measured in the form of predictive sales analytics, a sales pipeline analysis, sales effectiveness analyses, or any other method that enables you to track and evaluate how your sales team is performing in various areas. Sales performance analyses allow managers to make data-driven decisions backed by hard data. They also help companies find their most profitable customers and work to better serve them and attract others like them.
Sales performance metrics examples are vast, and depending on your specific industry and business objectives, there are many different guides and templates you can utilize to help construct a sales performance analysis framework that is right for your sales team. A quality analysis might cover metrics such as sales growth numbers, sales targets, product performance, and lead conversion rate.
Sample KPI For Sales Manager
Whether you’re looking for a KPI for sales manager, KPI for sales coordinator, or KPI for sales support, you are likely to find what you are looking for with some research and careful planning. It could be useful to review sample KPIs, as they can give you an idea of what sorts of KPIs you should aim to monitor within your own organization. KPIs for sales coordinator are going to look a little different from KPIs for sales support. As such, it is important to take all aspects of the sales process into consideration when trying to outline some quality KPIs for your business to track.
A sample KPI for sales manager, for instance, can give you a sense of what your sales manager should be monitoring. For more information on how to measure sales manager performance, you might also look at what others in your industry have done—see what’s working well for them and what isn’t. Some essential KPIs that every sales manager should track are new leads, wins, revenue growth, customer lifetime value, net promoter score, and client retention. You will also have to search for some insights into your own business to determine what other KPIs are worth tracking for your specific sales operations. KPIs are incredibly important, but knowing which ones are most important to your company, as well as how to properly monitor them, is even more crucial.


