.svg)
.svg)
.svg)
30 Sales Report Templates that Keep Teams Accountable

Sales reports can add critical value. Run correctly and presented in a compelling way, they deliver clear insights to you and your team. The problem: They are often a pain to create, no fun to look at, and something your team is loathe to actually read, which is why companies like FiveStars, Wayfair, and Lyft have turned to Ambition for help.
If you're struggling to create and disperse compellign sales reports, here are 30 sales reports templates to create and track over time.
30 Sales Report Templates to Hold Teams Accountable
1. Open activities by sales rep for this month.
How many activities has a rep performed against open opportunities this month? Activities can be calls, emails, meetings, or something to that effect. The higher the activity volume by each rep, the better. Outreach's Sales Automation tool can auto-log all these activities into Salesforce and attribute them to an opportunity. Ambition can visualize them in front of each rep.
2. Closed activities by sales rep for this month.
How many activities has a rep performed against closed opportunities this month? Activities can be calls, emails, meetings, or something to that effect. The lower the activity volume by each rep, the better. A high activity volume indicates you need to offload more duties to support and customer success.
3. Number of outreach emails sent.
How many outreach emails are your reps sending? If you want to zero in on cold emails, only, segment and define "New Prospect Emails" in your CRM.
4. Number of first contact or follow-up calls made
How many sales outreach calls are your reps sending? If you want to zero in on cold calls and follow-ups only, segment and define "new prospect calls" in your CRM. Here's how AMX Logistics uses Salesforce and Ambition to track these metrics.
5. Number of calls made in a row
Are your call blitzes actually call blitzes? How hard are salespeople hitting the phones during your designated call heavy hours. Number of calls in a row is a great way to get insight on that.
6. Specific types of calls
How are your sales team's calls going? This sales report can tell you how many outbound calls are voicemails, connections, conversations, rejections and so forth.
7. Average length of call time
This sales report can give insight into the ideal cold call length, qualification call length, and so forth.
8. Number of meetings scheduled or conducted
9. Number of proposals sent
How many proposals did your Account Executives give out today that are just a signature away from becoming closed deals? We only count each proposal the first time it's delivered, not in subsequent swaps back and forth during contract negotiations. DocuSign, GetAccept and HelloSign all offer great tracking on these.
10. Opportunities by sales rep
The number of opportunities each rep is working is a key report and should factor into the rest of your evaluation regarding their performance. Running a sales report that gives the total opportunity overview for each rep is key.
11. Opportunities with less than 'x' number of activities
The next sales report that logically follows is a search for opportunities with minimal associated activities in Salesforce or your CRM. These can help identify bloated pipelines before they become a problem.
12. Open opportunities report by created date and rep
Again, opportunities that have been sitting around for 18 months are likely not truly "open." This sales report is an easy way to spotlight those before they become a problem.
13. Opportunity conversion ratio report
What's the batting average for each rep, including both opportunities lost and opportunities that failed to close. The latter is what distinguishes this report from a win ratio report.
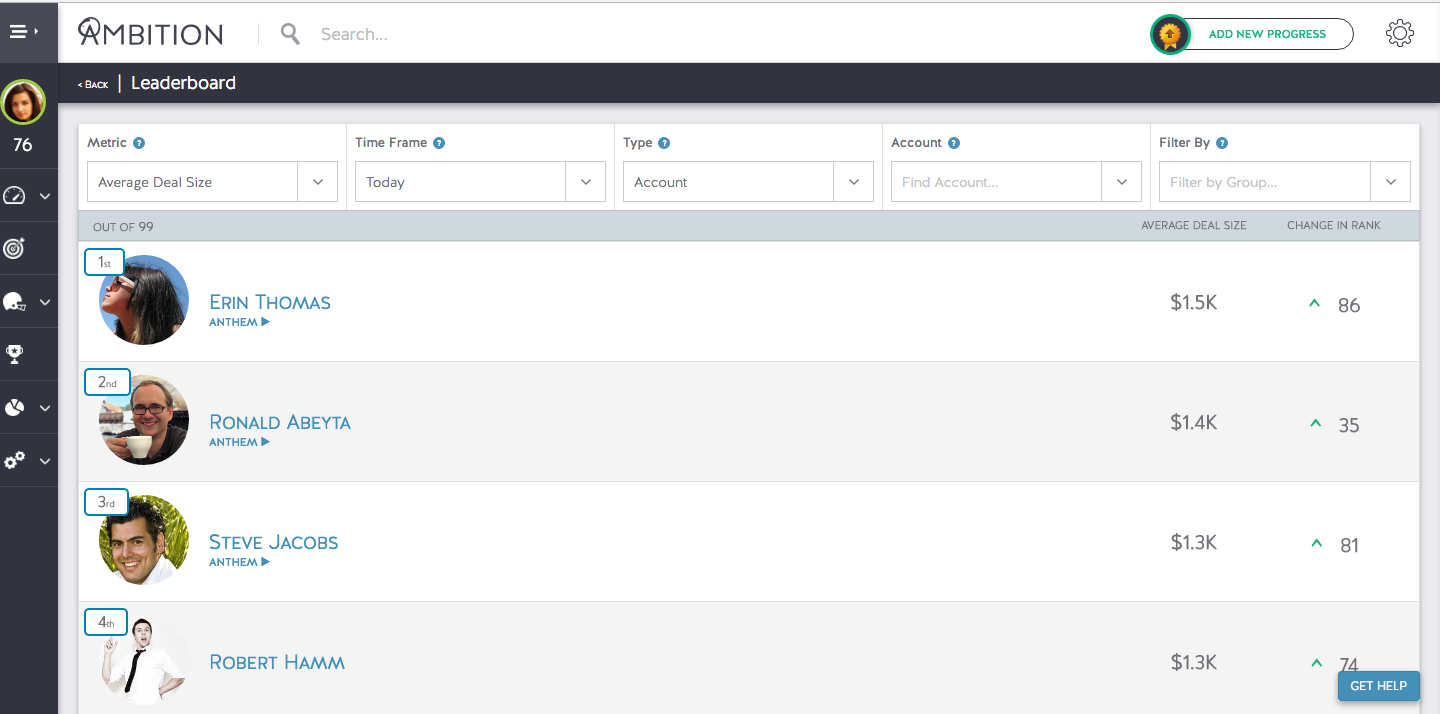
14. Average deal (or closed won) size report
How big is the average deal a rep is closing? Size matters when it comes to average contract value, so figure out what that is, how it's trending and how to increase it across your team.
15. Won vs. lost opportunities for this year
This is a key sales report. Distinguishing win percentage of opportunities is critical to assessing things like lead qualification, targeting, market positioning and positioning versus competitors. Use this report to segue into -
16. Opportunity win rate
The opportunity win rate sales report should be viewed in tandem with aggregated reports of won and lost opportunities for the year.
17. Top 10 accounts with open opportunities report
Tiering accounts as Tier 1 (hot), Tier 2 (warm) or Tier 3 (cold) is becoming all the rage in terms of targeting, viability and interest. Creating this report and sharing it with your team tells them who to focus their time on. Use tools like Infer to assess which opportunities are most viable.
18. Progress to sales goal
Sense of progress is the strongest motivator to your sales force - even more so than recognition and compensation. Visualizing each rep's real-time progress towards their sales goal makes for a compelling sales report. Here's a look at how ChowNow uses Ambition to give each rep total insight into this report.
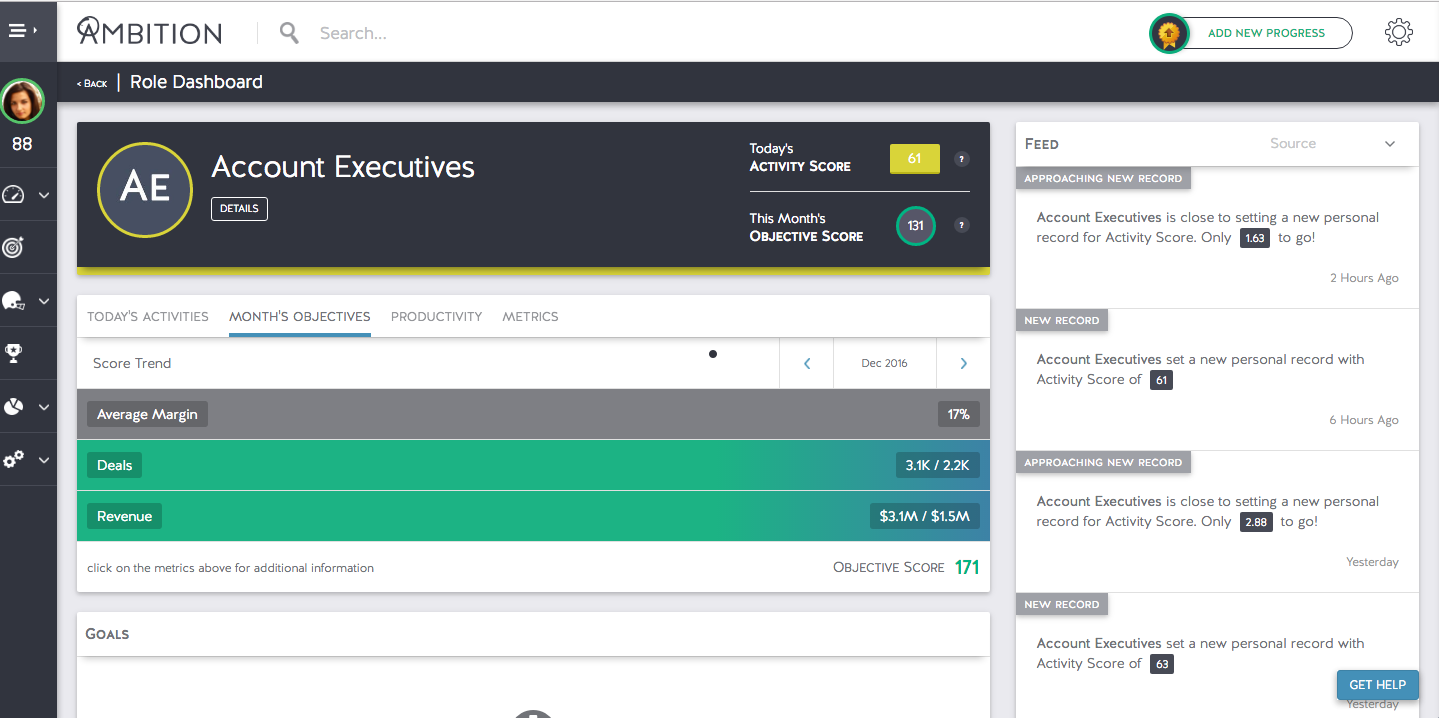
Here's how AMX tracks progress towards an advanced metric goal, in this case revenue margins on loads delivered by its Savannah office, at the team level.
19. Sales cycle length
How long does it take each of your reps to close a deal, on average. Running this sales report based on opportunity created dates versus opportunity closed won dates gives great insight into that metric. Knowing sales cycle length also opens the door to further insights, like how company size, industry, and target level impact sales success.
20. Trend in pipeline by stage report for past 6 months
Starting the first of each month, how is a rep's pipeline trending? Are opportunities moving along as they should, or staying put? Are open opportunities getting closed won or closed lost, or just sitting there with no movement either way? A great way to assess pipeline viability in an instant.
21. Opportunity stage movement
A great report that shows all the meaningful updates to sales opportunities each month. What deals were lost? What deals were won? What new are opportunities are emerging and which ones are closest to conversion this month? All visible via this report.
22. Time spent selling
How much of your sales team's time is spent selling? Running a report on this metric can be tough for some managers, but using Ambition, sales leaders like AMX Logistics General Manager Jared Moore have been able to create auto-alerts and recurring reports that notify them as to who is spending time selling and who is doing other, less important activities.
23. Closed opportunities by quarter
Closed opportunities by quarter gives you a high level look at meta-trends in your sales organization. These reports can include both closed won and closed lost, or could focus on one or the other individually. Either way, they let you see the key outcomes of the major accounts your reps spent their time and energy working on throughout the year.
24. Easier or more difficult time achieving quota?
A report that can be difficult to generate, which is why Ambition developed our Productivity Quadrant that compares activity level to goal acquisition across your organization. See how ChowNow VP of Sales Drew Woodcock uses the Quadrant to make these assessments instantly using company Salesforce data.
25. Which months are typically above or below quota?
A sales report that benefits organizations with seasonal buying behavior, in particular. Reports that show quarterly quota in terms of month-to-month progress give great forecast indicators and are useful for future one-on-ones.
26. New opportunities and closed opportunities each month
To ascertain pipeline health, look no further than this report. If the number of closed opportunities each month is significantly greater than the number of new opportunities, a pipeline problem exists. The sooner you can spot a potentially troubled pipeline, the better, so make this sales report an integral part of your sales reporting calendar.
27. Pipeline opportunities by close date and stage report
Adding an expected close date to opportunities, using previous metrics like standard sales cycle length, creates a timeline for reps and adds additional meaning to a simple pipeline opportunity sales report.
28. Closed won opportunities team (sales) reports
These should be reviewed from a monthly, quarterly and yearly perspective. Knowing the volume of deals closed and new revenue at a given time is important. Knowing how those numbers are trending over time is just as essential. Here's an image of Ambition's organizational dashboard, which lets managers see these monthly numbers and scroll through a trend line for historical comparison.

29. Closed won opportunities (sales) reports
Same as the above, except per rep instead of per team. Context is the key to gaining insight.
30. Sales volume by location
Last but not least, comparing sales volume by office location is an essential report for companies with more than one office. Here's how AMX Logistics tracks its sales metrics across 4 office locations via Ambition.
More Sales Reports Templates and Ideas
For more sales report templates and ideas, check out our Sales KPI Index and list of 26 Daily Sales Goals.
Ambition: Sales Performance Accountability Software
Ambition is a sales management platform that syncs business teams, data sources, and performance metrics on one system.
Modern sales leaders use Ambition to enhance sales performance insights and run supercharged sales reports, scorecards, contests, and TVs via drag-and-drop interface.
Ambition is endorsed by Harvard Business Review and AA-ISP (the Global Inside Sales Organization). Hear more from business leaders who use Ambition in their organization.
Watch Testimonials:
- FiveStars: Adam Wall. Sr. Manager of Sales Operations .
- Filemaker: Brad Freitag. Vice-President of Worldwide Sales.
- Outreach: Mark Kosoglow. Vice-President of Sales.
- Cell Marque: Lauren Hopson. Director of Sales & Marketing.
- Access America Transport: Ted Alling. Chief Executive Officer.
Watch Product Walkthroughs:
- ChowNow. Led by Vice-President of Sales, Drew Woodcock.
- Outreach. Led by Sales Development Manager, Alex Lynn.
Read Case Studies:
- Wayfair: Daily outbound calls increased by 100%.
- Peek: Monthly sales activity volume grew 142% in 6 months.
- Vorsight: Monthly sales conversations grew 300% in 6 months.
Contact us to learn how Ambition can impact your sales organization today.
See the system in action
Insights for high-achieving sales teams


Stop chasing targets, start predicting revenue
Transform your revenue org into a high-performing growth engine with structured insights, top-down visibility, and built-in consistency.
%20(1).png)
.svg)
.svg)