When it comes to coaching, there isn't a one-size fits all approach. Using different graphs like the quadrant or histogram can help you identify your reps that may be strong in one area like closing, but weak in another like price discounting. Here are some strategies to help you identify coachable moments and metrics for your sales team.
Measure cause and effect metrics on a quadrant view
Using a quadrant or scatterplot is a super easy way to measure ratio metrics and identify high input and high output achievers. Here is the breakdown of each corner in the quadrant :
-
Top right is your sweet spot. These are your reps with high input on things like calls that are yielding high output on things like meetings set.
-
Top left is probably a CRM adoption problem. If someone has ultra high output with minimum input, they’ll fall in the top left corner. This likely signifies that they aren’t logging activities like calls or meetings in the CRM and this should be investigated. If they are logging all activity and are just able to convert almost every single one, then they should definitely be leading some peer coaching!
-
Bottom right are your hustlers that need a little refining on their pitch. If someone is cranking out calls but never getting a meeting set, they’ll find themselves in the bottom right corner. These are the reps that show their heart is in the right spot, but they don’t have the skills to close. Work specifically with this group to make sure they’re dialing the right ICP, their pitch is smooth, and they understand how to handle objections.
-
Bottom left is a troubling place to land on the quadrant. This signifies very little input on daily sales activities with an expected very little output. Ensure that this team understands the daily expectations and consider using a scorecard to enforce the daily activities
Examples of cause and effect metrics that are worth correlating
Now you know you want to look at “cause and effect metrics” (sometimes also referred to as efficiency metrics, moneyball metrics, or conversion metrics), you might be looking for a little inspiration for which ones to drill down into. Here are some examples:
-
Connects to meetings held
-
Shows how good the rep is at the meeting set pitch and objection handling, shows they are dialing the right icp, and is better than calls to meeting set because connects are more of an opportunity than a dial where no one answers!
-
-
Meetings set to meeting held
-
Shows the reps who are setting the most qualified meetings and aren’t wasting AE’s time with no-show meetings just to get commission on a set. Bonus tip: consider bonusing your SDRs on meetings held rather than meetings set!
-
-
Opportunities to Closed: Won deals
-
Shows which reps are your best closers and who could use a little bit of work on their demo or talk track
-
-
Emails sent to emails opened
-
Shows who is finding the right ICP and who has the capability to personalize at scale grabbing engagement right from the subject line.
-
-
Calls to connects
-
Shows which reps are finding success with contacts at companies and the ICP
-
-
Activity score to objective score
-
This is a big picture look at overall conversion to see of all sales activities assigned in a scorecard, who is converting them to the right objectives.
-
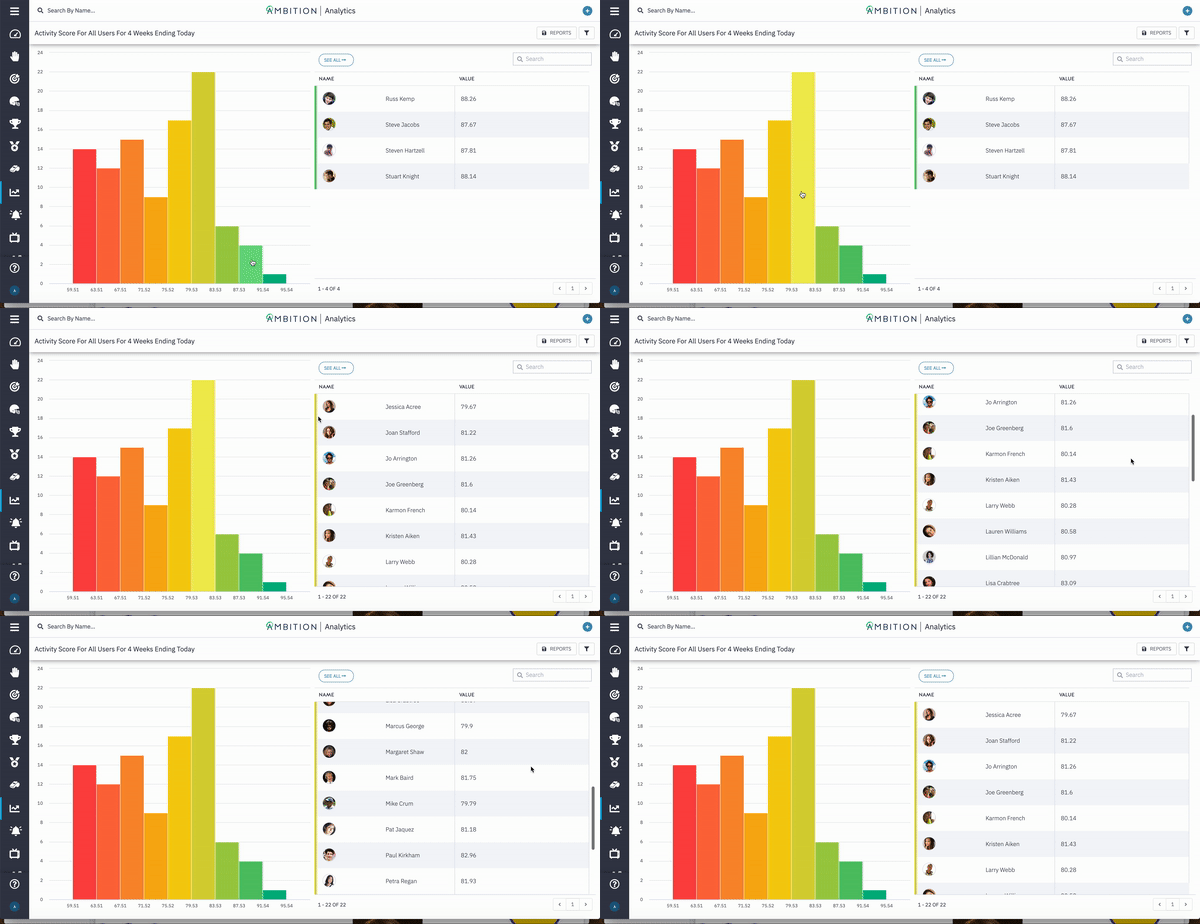
Use the Histogram to find averages and your middle performers
When focusing your coaching efforts on your middle performers, rather than the A+ players or the bottom tiered folks, you’ll actually get a bigger bang for your buck. The histogram, rather than showing performance over a timeline, takes a metric and groups it into ranges.
-
Look at “talk time”
-
Talk time is a good signal that your reps are making deposits with the person on the line, making an impression, and generally good at objection handling. Find your “yellow range” reps on the histogram and partner them up with the reps in the green range to learn how to better steamroll objections.
-
-
Look at average order value or revenue per call
-
If you only look at the volume of closed: won deals without considering average order value, you might be praising reps who actually rely too heavily on discounting to get the deal done. Identify your middle tiered folks on the average order value histogram and see if you can coach them to upsell, cross-sell, or discount less.
-
 Back
Back


