SALES PERFORMANCE MANAGEMENT: GETTING INSIGHTS AND TAKING ACTION IS EASIER THAN EVER
Managing sales performance effectively centers on one key thing: data. Accurate data allows for managers and directors to make strategic decisions, pivot tactics quickly, and stay on pace to hit the end goals. With our newly revised metric sales dashboard, reps can self-evaluate where they stand amongst their team and org, managers can identify the right metrics to launch competitions around, and coaching is easily personalized to the key areas that a rep needs to improve.
The refresh of the metric view includes:
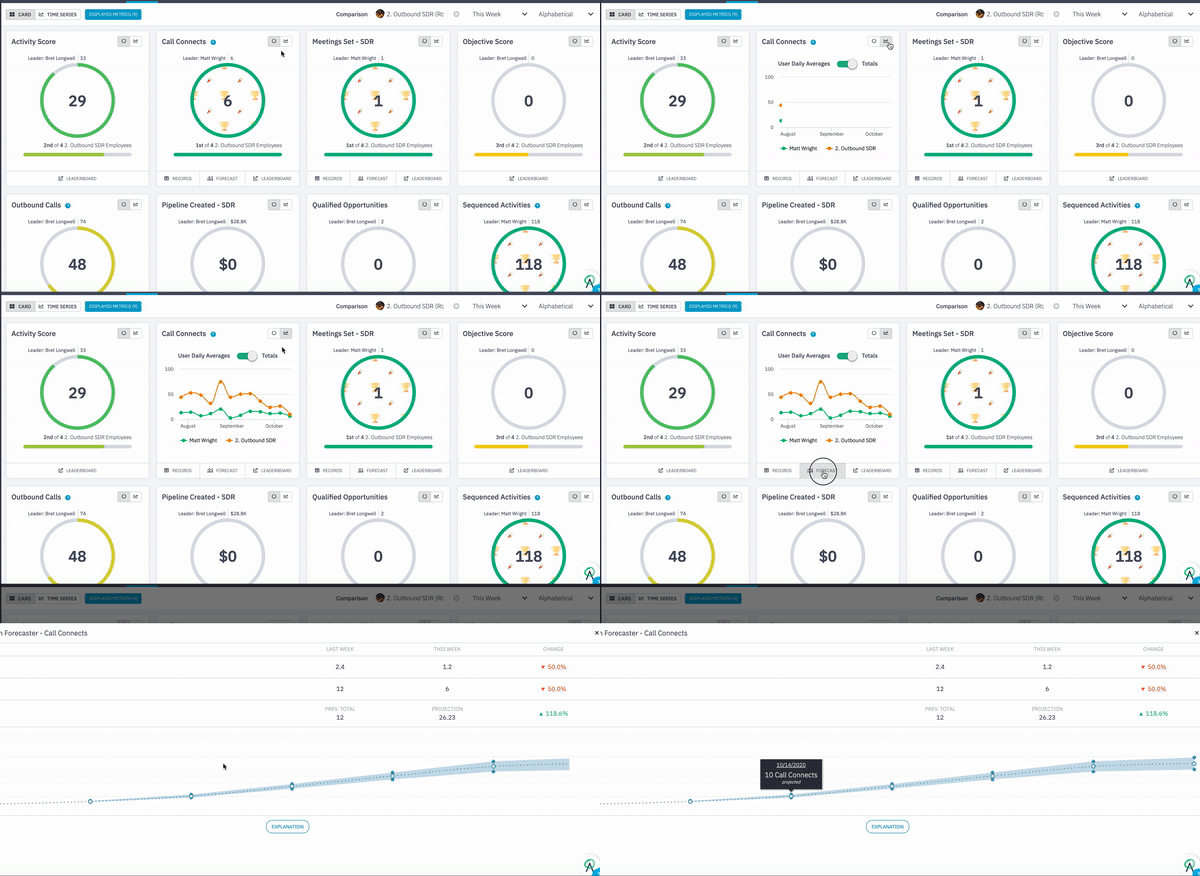
- A default view of just the metrics you or your reps are scored on. As a rep I see my personalized metrics. As a manager, you can see the team KPIs
- A call out with some design flair that lets you see the metrics you rank first in
- Performance projections moved inline for each KPI and more
This was a big win for a number of our enterprise clients who want to personalize the metric view to their region, team, and more-- we're excited about it and I know some customers are too!

^^^ the homies said "thanks" back, by the way. ;)
Using the metric KPI dashboard to launch the right gamification tactics
1. It's noon and the activity score for the BDR team is only at 38 (it needs to be 100 by 5 pm!)
The metric dashboard shows you a roll up of your team or the entire role and allows you to see a comparison against other teams. At noon, managers can look at the activity score for the team and if they are half way to the 100 mark. If activities are light and your BDRs are trailing the AEs, kick off a competition for an hour long activity blitz for an instant boost in the output.

2. Your team is on the second day in a row of low appointment sets and you don't want to blow the weekly target
Use the trend graph right in line on any metric to get ahead of performance that is dipping. When you see performance low for a simple KPI for something like meetings set, you can broadcast a quick leaderboard in Slack and let your sales development team know that the leader at Friday 10am gets to go home early! It is only a few clicks for the manager, and rallies the whole team to move the metric in the right direction

3. As a rep, see which metrics you're winning, and get competitive on the ones you have a shot to overtake
Ambition adds some party flair to your metric dashboard on any KPIs you're currently the rank leader. You can also see the metrics where you're close to goal and the leader that you want to overtake. Submit a quick employee ask to be put into a head-to-head challenge with the rep and battle it out and maybe talk a little trash along the way. You may end up hitting goal AND winning a prize. I've got my money on Tyler to take Jeff on the Revenue metric.

Coaching your reps and team with the metric dashboard
1. See how each rep's daily averages stack against the team critique and coach accordingly!
In this look, Russ's manager knows he is ahead of the BDRs on appointments set-- winning by a mile, but his new leads are too far down to set him up for a successful meeting run in the coming days. Congratulate Russ on a job well done on his pitches and sets, but ensure he corrects that blind spot with leads and is filling the top of the funnel so he doesn't blow it in the coming days.

2. Sneak a peek at how your junior business development reps are crushing the senior business development reps in nearly every metric. Then overtake the last one
In this look a manager can compare jr BDRs to sr. BDRs and get ready to brag to the director when the young ones win the day, week, or month. Out of 8 shared KPIs, only objective score is lagging, so the manager can call a team meeting to rally the group on what needs to be done to take the lead-- or even challenge the sr team to a head-to-head challenge in Ambition. The team performance look really works to create accountability and motivate reps who may not be driven by individual competiton. In each individual coaching 1:1 or team meeting, the manager can keep the team focused on the remaining metric to snipe.

3. Identify your middle performers in a single click
This one technically doesn't exist on the new metric dashboard, but it's only one click to the left so it was worth a mention. The productivity quadrant just got that. much. better. with interactive clicking functionality. Anyone in the bottom right corner of your quadrant is doing a great job putting in work on activity, but needs some help when it comes to converting that activity to key objectives. This is the group who has the hustle, and just needs some skill refinement. When you focus on this group, you can be sure the coachability is there as well as the desire and drive, which makes it that much easier to pull them into the top right performing quadrant. Help your team visualize where they rank on activity input to how it converts to key objectives with the quadrant view.
Simply search the rep's name and show them where they land on converting their activities like calls to objectives like meeting sets
Want to quickly find who that top or bottom performer is for all of the rolled up performance data? Click any dot on the quadrant to find out:

 Back
Back


