.svg)
.svg)
.svg)
8 Sales Onboarding Metrics That Predict Ramp Time

.png)
Sales managers know that ramp time determines how quickly new hires contribute to pipeline and revenue. The challenge is identifying which early signals actually predict whether a rep will hit full productivity in four months or eight.
This guide breaks down nine onboarding metrics that give you visibility into ramp trajectory before lagging indicators tell you what went wrong. Ambition helps revenue teams track these metrics automatically, turning onboarding data into actionable coaching insights.
Quick guide: 8 sales onboarding metrics that predict faster ramp time
- Time to first logged activity: Tracks how quickly new reps begin real selling behaviors after day one
- Knowledge lift score: Measures learning gains between pre-onboarding and post-onboarding assessments
- Manager coaching cadence compliance: Monitors whether scheduled 1:1s and call reviews happen on time
- Time to first opportunity created: Indicates when reps start contributing to pipeline
- Onboarding certification pass rate: Shows field-readiness at the end of structured training
- Percentage to quota at 30/60/90 days: Reveals pacing toward full quota attainment
- Buddy shadow session count: Tracks peer-led learning during the first weeks
- Ramp win rate delta: Compares new hire conversion rates against experienced reps
How we identified metrics that predict faster rep ramp time
When selecting these nine metrics, we focused on indicators that sales managers and RevOps leaders can act on during onboarding rather than waiting for quarter-end results to reveal problems.
- Leading over lagging: Each metric signals future performance before revenue closes, giving you time to intervene
- Manager-actionable: These are numbers frontline leaders can influence through coaching, not just observe
- Cross-functional visibility: The metrics create shared language between enablement, operations, and sales leadership
- Tied to outcomes: Research shows these indicators correlate with faster time-to-productivity and lower early attrition
- Trackable at scale: Each metric can be monitored across cohorts without manual data collection when you have the right systems
The 8 sales onboarding metrics that predict ramp time
1. Time to first logged activity: When new reps start real selling behaviors
Time to first logged activity measures calendar days between start date and first recorded sales action in your CRM or engagement platform. This includes outbound calls, personalized emails, or booked meetings.
A short time-to-activity signals that onboarding systems work correctly, the rep feels confident enough to engage, and expectations are clear from day one. A long delay may indicate blocked tool access, unclear priorities, or confidence gaps that need coaching attention.
Time to first logged activity features
- Early engagement signal: Reps who log their first activity within the first week typically show stronger ramp trajectories
- System readiness check: Delays often expose IT setup issues or incomplete CRM access rather than rep performance problems
- Coaching trigger: Managers can use this metric to identify reps who need extra guidance navigating their territory or prioritizing accounts
Time to first logged activity pros and cons
Pros:
- Gives immediate visibility into new hire engagement within the first week
- Helps identify operational blockers like missing tool access
- Simple to track through CRM timestamp data
Cons:
- Does not measure activity quality or whether outreach follows best practices
- Can be influenced by territory assignment timing rather than rep readiness
- Outliers from holidays or sick leave require manual adjustment
2. Knowledge lift score: Measuring learning gains during onboarding
Knowledge lift score compares assessment results from before onboarding to after, expressed as a percentage improvement. If a rep scores 55% on a pre-onboarding product quiz and 82% afterward, they achieved a 49% knowledge lift.
This metric shows whether training content actually transfers knowledge. A high lift indicates effective onboarding curriculum, while a flat score suggests content needs revision or delivery methods require adjustment.
Knowledge lift score features
- Learning effectiveness indicator: Quantifies intellectual gains from onboarding rather than just tracking completion
- Content quality signal: Low lift scores across a cohort point to curriculum gaps rather than individual performance
- Baseline comparison: Helps enablement teams identify which modules produce the strongest learning outcomes
Knowledge lift score pros and cons
Pros:
- Shows actual learning rather than seat time or completion checkboxes
- Identifies content that works versus content that needs improvement
- Useful for comparing onboarding program versions over time
Cons:
- Requires consistent pre and post assessments to track accurately
- Measures short-term retention, not whether knowledge applies in live selling
- Reps with strong prior experience may show smaller lifts despite readiness
3. Manager coaching cadence compliance: Ensuring structured support happens
Coaching cadence compliance measures the percentage of scheduled 1:1 sessions and call reviews completed with new hires during their first 60 days. If your onboarding plan prescribes eight coaching touchpoints per rep and a manager delivers six, compliance is 75%.
This metric holds managers accountable for reinforcing training through regular coaching rather than assuming development happens organically. Research consistently shows that reps who receive structured coaching during ramp achieve productivity faster than those left to figure things out independently.
Manager coaching cadence compliance features
- Manager accountability: Creates visibility into whether frontline leaders deliver the coaching your onboarding program requires
- Consistency signal: High compliance across managers indicates your sales leadership team invests in development
- Intervention trigger: Low compliance for specific managers may indicate capacity issues requiring additional support
Manager coaching cadence pros and cons
Pros:
- Creates accountability for consistent coaching during the critical first months
- Identifies managers who need capacity support or additional training
- Correlates with faster ramp when cadences are maintained
Cons:
- Measures session completion, not coaching quality or rep outcomes
- Requires a tracking system to log sessions accurately
- Does not capture informal coaching moments that can happen outside scheduled sessions
4. Time to first opportunity created: When reps start building pipeline
Time to first opportunity created tracks calendar days from start date until a rep logs their first qualified opportunity in the CRM. This metric shows how quickly new hires transition from learning to actively contributing pipeline.
Unlike time to first deal, which depends on sales cycle length and can take months, first opportunity gives you an earlier signal of productive behavior. A rep who creates their first opportunity in week three is on a different trajectory than one who takes eight weeks.
Time to first opportunity created features
- Pipeline initiation speed: Shows when reps move from activity to outcomes that matter for revenue operations
- Territory validation: Delays may indicate territory quality issues rather than rep capability
- Forecasting input: Helps RevOps predict when new hire pipeline will contribute to coverage
Time to first opportunity created pros and cons
Pros:
- Earlier indicator than closed revenue for predicting ramp success
- Shows reps are applying discovery skills and qualification criteria
- Useful for comparing ramp velocity across hiring cohorts
Cons:
- Opportunity quality varies, so first opportunity may not convert
- Depends on clear opportunity stage definitions to track consistently
- Inbound-heavy roles may show faster times that do not reflect prospecting skill
5. Onboarding certification pass rate: Confirming field-readiness
Onboarding certification pass rate measures the percentage of new hires who successfully complete required assessments at the end of structured onboarding. This might include product pitch certifications, discovery call evaluations, or tool proficiency checks.
Organizations often use certification as a gate before reps can take live calls or book real meetings. The pass rate tells you whether your onboarding program produces reps who meet your readiness standard, and which individuals need additional development before going live.
Onboarding certification pass rate features
- Readiness gate: Creates a clear standard for when reps can transition from training to selling
- Program effectiveness: Low pass rates across cohorts signal curriculum or delivery issues
- Individual development: Identifies specific reps who need targeted coaching before going live with customers
Onboarding certification pass rate pros and cons
Pros:
- Creates objective readiness criteria rather than subjective manager opinions
- Helps ensure quality control before reps engage with customers
- Provides data for improving onboarding content over time
Cons:
- Assessment design determines value; poor rubrics produce misleading results
- Certification does not guarantee real-world performance
- Multiple retakes can delay ramp without improving underlying skills
6. Percentage to quota at 30/60/90 days: Tracking ramp pacing
This metric tracks average quota attainment at key checkpoints during ramp. Measuring at 30, 60, and 90 days shows whether reps are pacing toward full productivity or falling behind early.
The power of checkpoint metrics is visibility into trajectory. A rep at 55% of their 60-day target is on a different path than one at 25%. Managers can use these signals to adjust coaching focus and sales development investments while there is still time to course-correct.
Percentage to quota at 30/60/90 days features
- Pacing visibility: Shows whether reps are on track before end-of-quarter surprises
- Cohort benchmarking: Compare current classes against historical performance to validate program changes
- Intervention timing: Identifies at-risk reps early enough to provide additional support
Percentage to quota at 30/60/90 days pros and cons
Pros:
- Provides structured checkpoints for reviewing ramp progress
- Creates urgency for addressing performance gaps mid-ramp
- Useful for forecasting new hire revenue contribution
Cons:
- Quota assignment must be accurate and appropriately ramped
- Early quota misses may reflect sales cycle timing rather than skill gaps
- Requires clear definition of whether quota is prorated or full
7. Buddy shadow session count: Tracking peer-led learning
Buddy shadow session count measures how many peer-led observation sessions a new hire participates in during onboarding. These sessions might include listening to live discovery calls, demos, or negotiations led by experienced reps.
Shadowing accelerates learning by exposing new hires to real selling situations before they take their own calls. In remote and hybrid environments, structured shadowing programs ensure peer learning happens rather than relying on informal osmosis that no longer exists.
Buddy shadow session count features
- Peer learning structure: Creates accountability for experience transfer between tenured reps and new hires
- Diverse exposure: Reps benefit from observing different selling styles to develop their own approach
- Remote-friendly: Structured shadowing works across distributed teams when documented properly
Buddy shadow session count pros and cons
Pros:
- Accelerates learning through exposure to real customer conversations
- Builds relationships between new hires and experienced team members
- Creates shared accountability for onboarding success
Cons:
- Quality depends on which reps serve as buddies and their teaching ability
- Requires coordination to schedule sessions without disrupting buddy productivity
- Does not measure whether reps apply what they observe
8. Ramp win rate delta: Comparing new hire conversion to experienced reps
Ramp win rate delta compares the win rate of new hires during their ramp period against the average win rate of fully ramped, seasoned reps. If experienced reps convert at 28% and new hires convert at 18%, the delta is 10 percentage points.
This metric reveals how close new hires are to matching field effectiveness. A narrowing delta over time shows that onboarding and coaching are working. A persistent gap signals deeper skill development needs or systemic issues with how new reps are deployed.
Ramp win rate delta features
- Effectiveness benchmark: Compares new hire performance against the standard your organization knows works
- Trend analysis: Track delta changes over ramp months to see if coaching closes the gap
- Program evaluation: Compare deltas across cohorts to measure onboarding improvements
Ramp win rate delta pros and cons
Pros:
- Shows how quickly new hires approach experienced rep performance
- Identifies whether skill gaps exist beyond what activity metrics show
- Useful for evaluating coaching and enablement
Cons:
- Requires sufficient deal volume for statistical significance
- Win rate varies by segment and deal size, requiring careful comparison
- External factors like territory quality can influence results
Comparison table: Sales onboarding metrics that predict ramp time
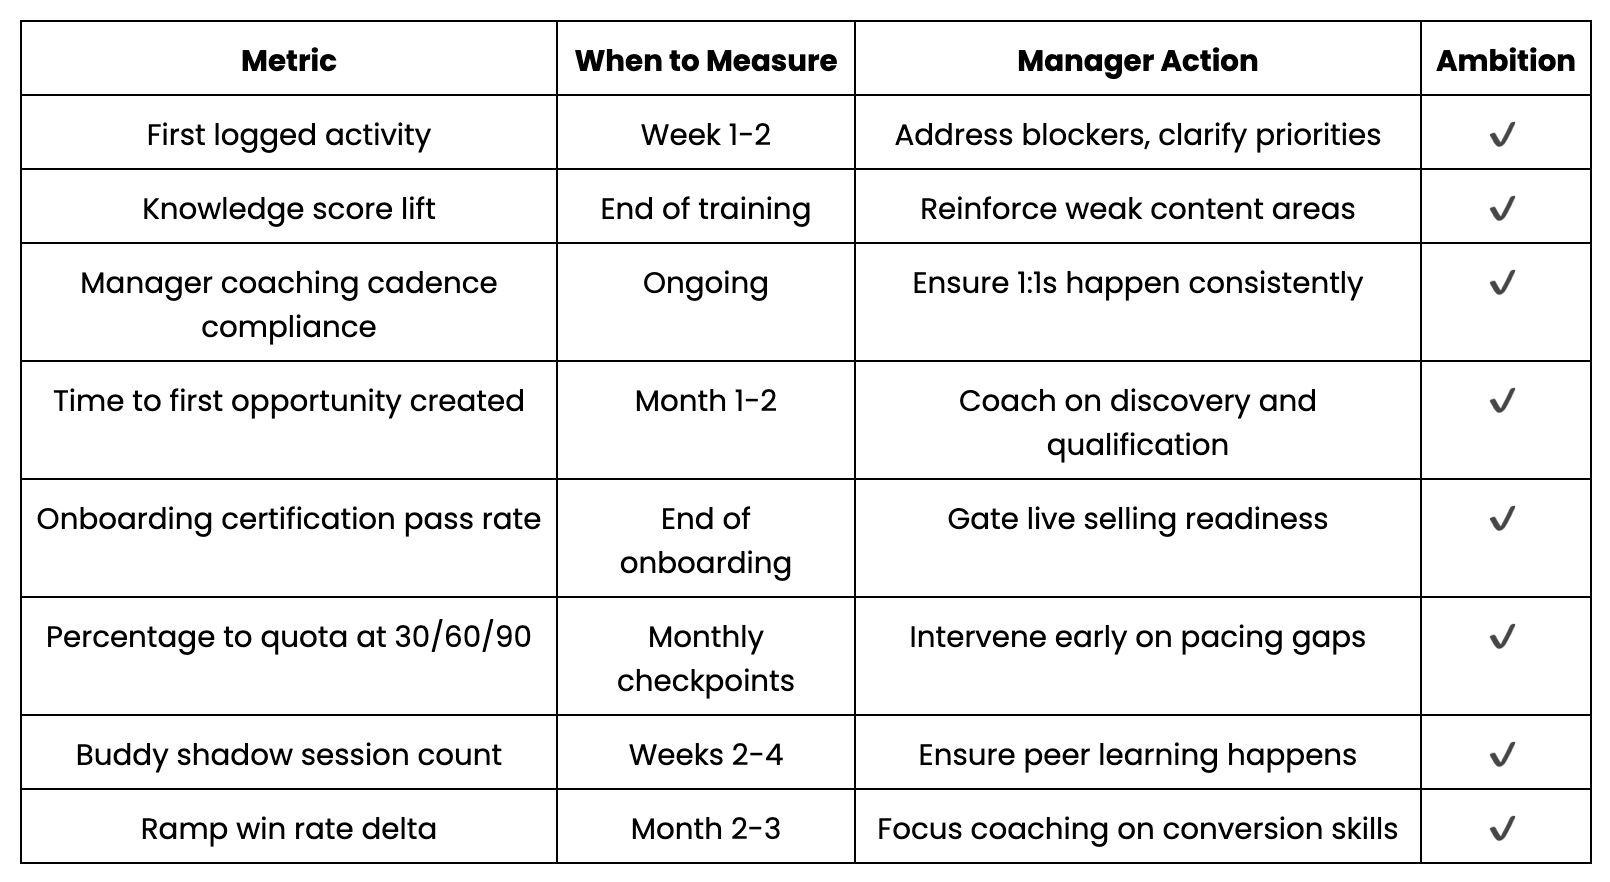
How do sales managers use onboarding metrics to improve ramp time?
Tracking onboarding metrics only creates value when managers act on the data. The most effective approach combines automated visibility with structured coaching rhythms that address gaps as they emerge.
Start by establishing baseline expectations for each metric based on your top performers. If your fastest-ramping reps historically log their first activity by day five and create their first opportunity by week three, those become your benchmarks. When current hires fall behind those markers, managers have specific coaching conversations rather than generic check-ins.
Weekly reviews of ramp metrics during team meetings create accountability for both reps and managers. Ambition makes this easy by surfacing the exact metrics and trends that need attention, freeing managers from manual data gathering so they can focus on development.
What is the difference between leading and lagging ramp indicators?
Leading indicators signal future performance and give you time to intervene. Lagging indicators tell you what already happened after the opportunity to course-correct has passed.
Activity metrics, coaching completion rates, and time-to-first-activity are leading indicators. They predict whether a rep will hit quota before revenue closes. Closed-won deals and final quota attainment are lagging indicators. By the time you see a miss, the quarter is over.
The best ramp programs weight leading indicators heavily during months one and two, then shift focus toward outcome metrics as reps approach full productivity. This approach catches problems when coaching can still make a difference.
Why Ambition is the best platform for tracking sales onboarding metrics
Sales onboarding success depends on consistent visibility, structured coaching, and accountability across the revenue organization. Ambition delivers all three through a unified platform that turns ramp data into action.
Where point solutions track individual metrics in isolation, Ambition connects activity data, coaching documentation, and performance outcomes in one system. Managers see exactly where each new hire stands against benchmarks and receive AI-powered recommendations on where to focus development efforts. Organizations using Ambition report 33% faster ramp times and 7 hours of weekly time savings for managers.
If you are ready to build an onboarding program that produces predictable, repeatable ramp results, schedule a demo to see how Ambition can help your team.
FAQs about sales onboarding metrics that predict ramp time
What is the most important metric for predicting sales rep ramp time?
Time to first opportunity created offers the strongest early signal because it shows when reps transition from activity to pipeline contribution. Ambition tracks this automatically alongside complementary metrics so managers see the full picture without manual data pulls.
How often should managers review onboarding metrics for new reps?
Weekly reviews during the first 90 days allow managers to identify gaps and adjust coaching before small issues become patterns. Ambition surfaces metric changes in real time through automated alerts and dashboard updates, making weekly check-ins efficient.
Can onboarding metrics predict which reps will stay long-term?
Research shows reps who ramp successfully are more likely to stay with the organization. Tracking post-onboarding productivity sustainment helps identify reps at risk of disengagement even if they performed well during formal onboarding. Early intervention through structured coaching can address retention risks before they lead to turnover.
What role does manager coaching play in accelerating ramp time?
Coaching cadence compliance directly correlates with faster ramp outcomes. Reps who receive consistent, documented coaching during their first 60 days reach full productivity faster than those who receive ad-hoc feedback. Ambition's Coaching Orchestration tools ensure sessions happen on schedule and are documented for continuous improvement.
How do I benchmark onboarding metrics against industry standards?
Industry benchmarks vary significantly by role complexity and sales cycle length. SMB reps typically reach 80% of quota in 3-4 months, mid-market in 5-7 months, and enterprise in 9-12 months. Your own cohort data matters more than external benchmarks because it reflects your specific product, market, and enablement investment.
See the system in action
Insights for high-achieving sales teams

.png)

Stop chasing targets, start predicting revenue
Transform your revenue org into a high-performing growth engine with structured insights, top-down visibility, and built-in consistency.
%20(1).png)
.svg)
.svg)